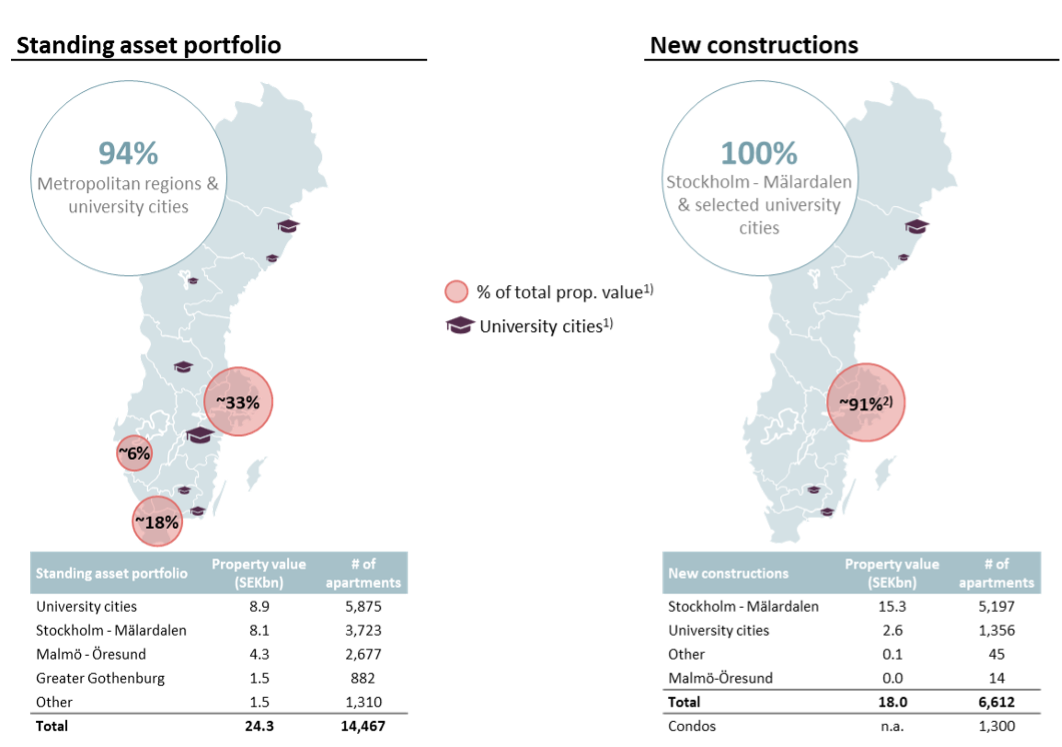
The graph below illustrates Sveafastigheter’s standing asset portfolio as well as new constructions, highlighting the geographical overlap between the two, as of June 30, 2024.
1) Excluding municipalities that represent less than 1 percent of total property value.
2) Based on project development, including condominiums.
